The first thing we will do is update the system repositories.
sudo apt update
Now we must ensure that openssh-server is installed; in my case, I always install it on Ubuntu Server during the initial OS installation.
sudo apt install openssh-server
And finally, we install the most recent version of Wazuh.
curl -sO [https://packages.wazuh.com/4.14/wazuh-install.sh](https://packages.wazuh.com/4.14/wazuh-install.sh) && sudo bash ./wazuh-install.sh -a
Once installed, the Wazuh credentials and password will be provided.
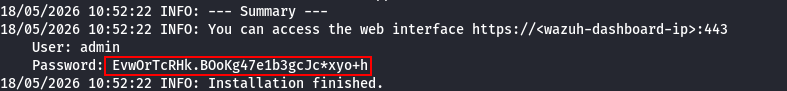 We must write it down, although we can change it later.
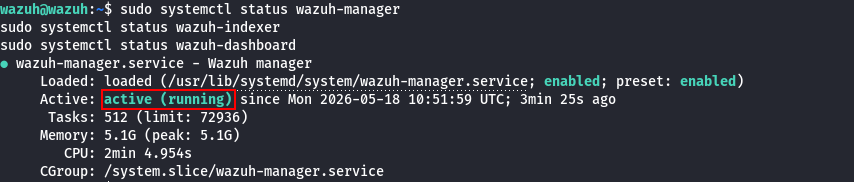
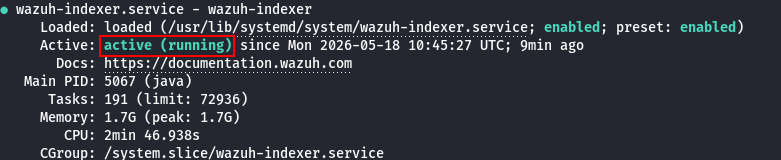
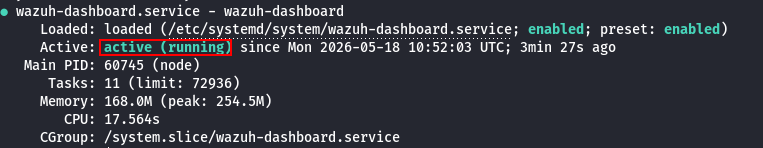
We must confirm the status of the following services to guarantee that the Wazuh server is successfully installed.
We must write it down, although we can change it later.
We must confirm the status of the following services to guarantee that the Wazuh server is successfully installed.
sudo systemctl status wazuh-manager
sudo systemctl status wazuh-indexer
sudo systemctl status wazuh-dashboard
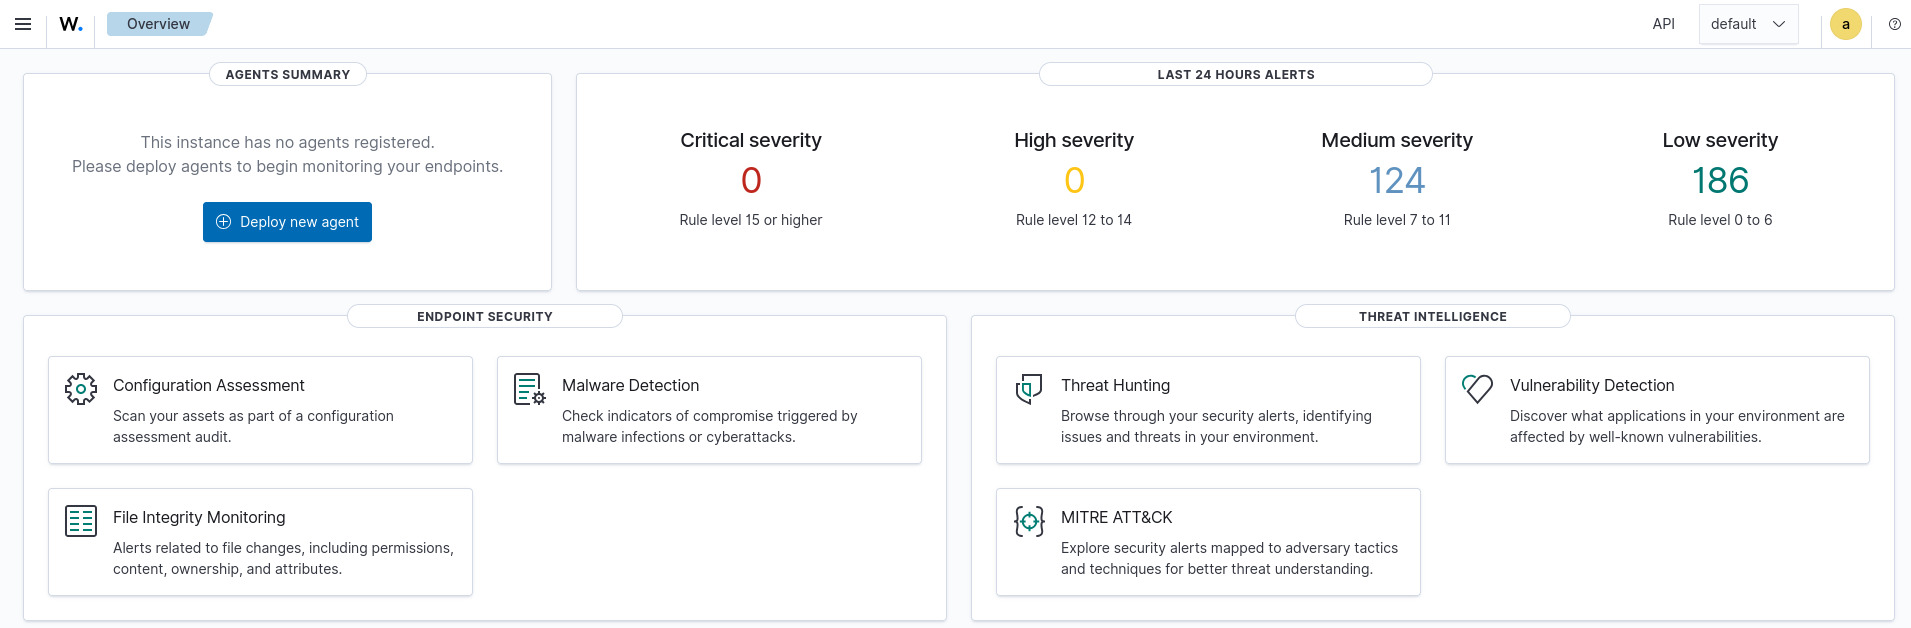
 Additionally, we must ensure that we can access the Wazuh dashboard over HTTPS.
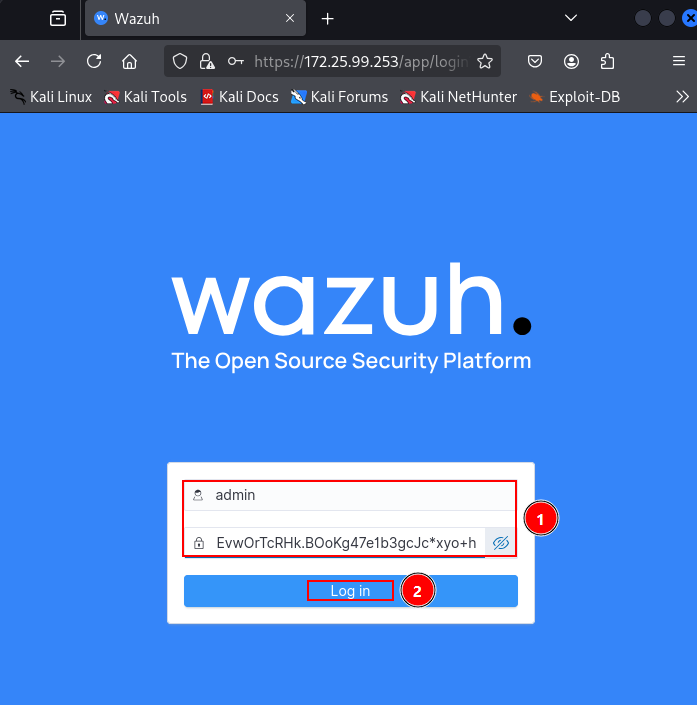
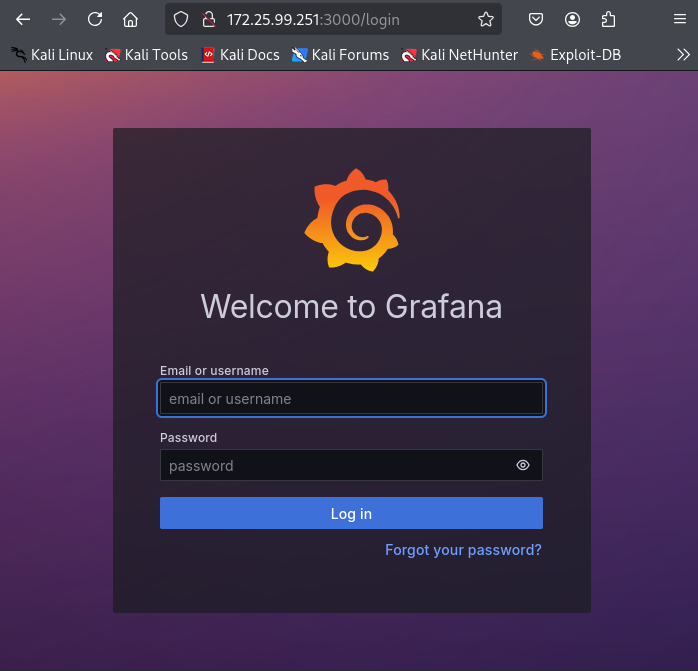
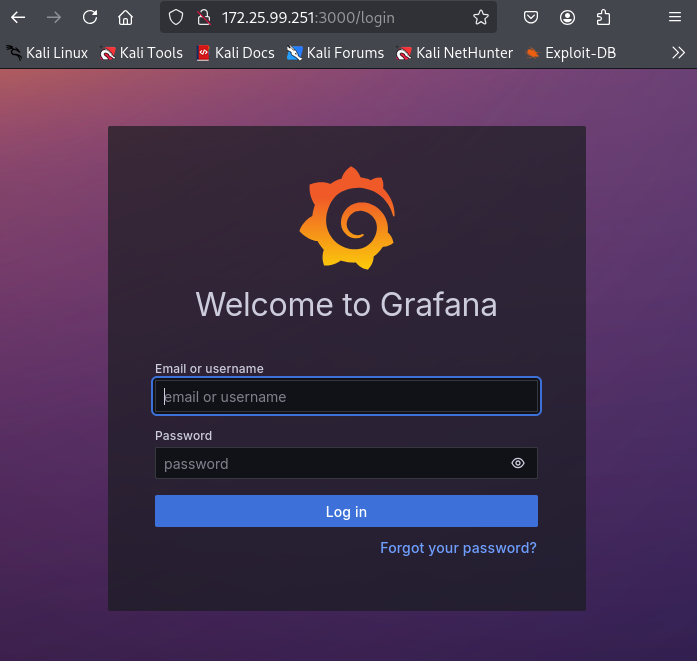
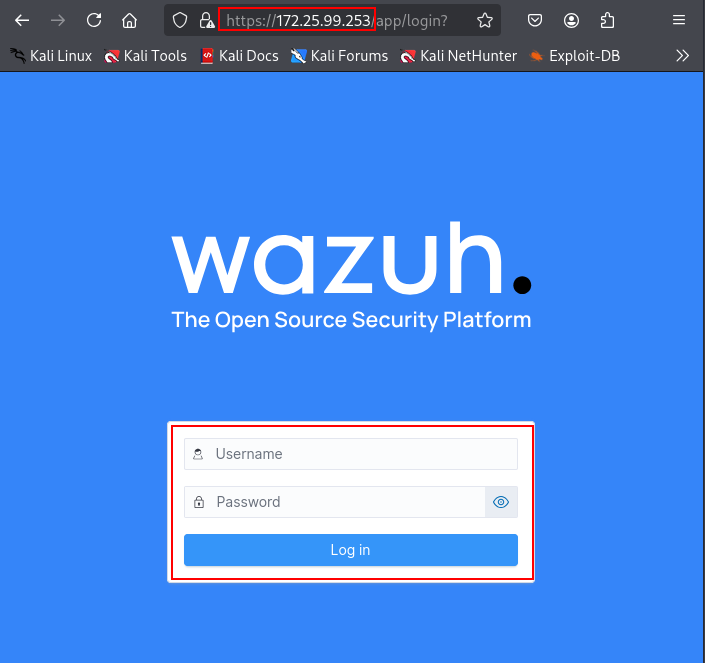 We can access the panel using the credentials that were generated during the installation phase.
To install Grafana, we first need to set up the repository dependencies.
sudo apt-get install -y adduser libfontconfig1 musl
wget [https://dl.grafana.com/enterprise/release/grafana-enterprise_11.1.0_amd64.deb](https://dl.grafana.com/enterprise/release/grafana-enterprise_11.1.0_amd64.deb)
sudo dpkg -i grafana-enterprise_11.1.0_amd64.deb
And enable the service.
sudo systemctl enable grafana-server
sudo systemctl start grafana-server
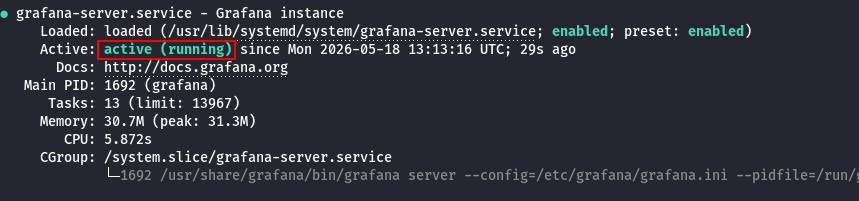
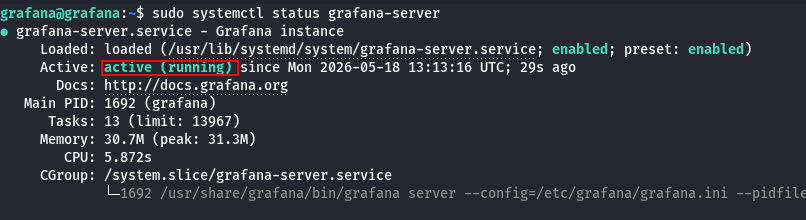
Then we verify that everything is running correctly.
This installation will be performed on the SONDA machine, which will later host the IPS.
The first thing we need to do is download and add the repository key.
curl -s [https://packages.wazuh.com/key/GPG-KEY-WAZUH](https://packages.wazuh.com/key/GPG-KEY-WAZUH) | sudo gpg --dearmor -o /usr/share/keyrings/wazuh.gpg
echo "deb [signed-by=/usr/share/keyrings/wazuh.gpg] [https://packages.wazuh.com/4.x/apt/](https://packages.wazuh.com/4.x/apt/) stable main" | sudo tee /etc/apt/sources.list.d/wazuh.list
sudo apt update
Now, we must install the package, passing the Wazuh Manager's IP address as an argument.
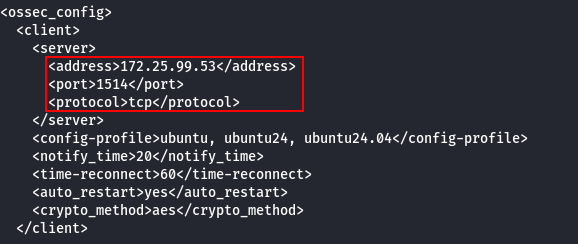
WAZUH_MANAGER="172.25.99.53" sudo apt install wazuh-agent
We can modify this address later in the configuration file /var/ossec/etc/ossec.conf once installed.
 Finally, we need to start the daemon.
sudo systemctl daemon-reload
sudo systemctl enable wazuh-agent
sudo systemctl start wazuh-agent
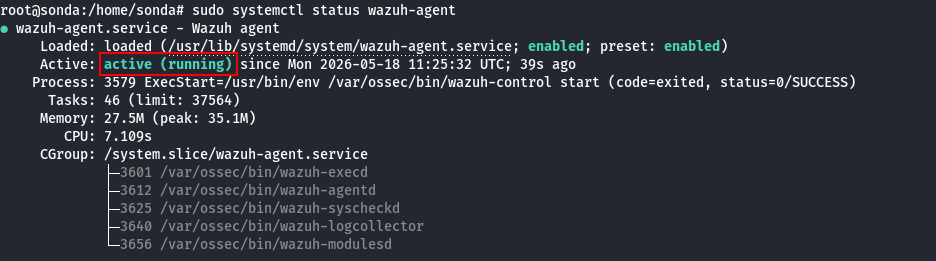
We can verify that the service is active from the SONDA machine.
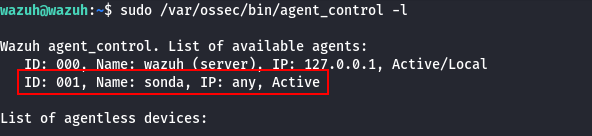
 To ensure the agent is successfully integrated from the manager's perspective:
sudo /var/ossec/bin/agent_control -l
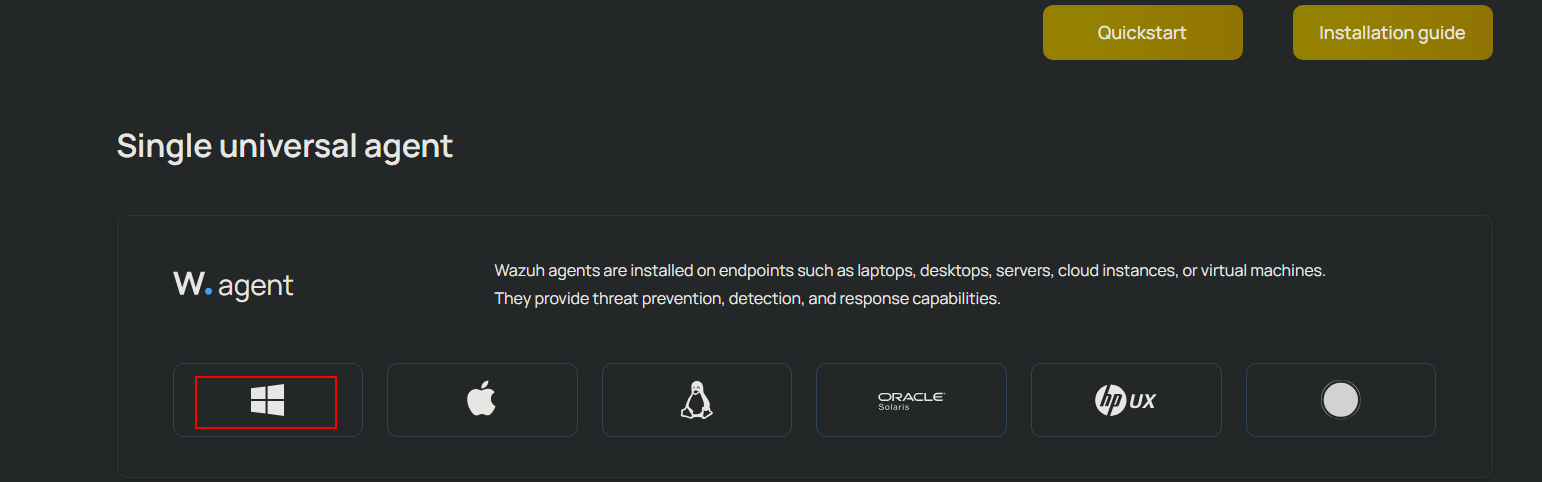
From the official website, I download the official installer.
 Now, from PowerShell, we will execute the installer using the following command:
.\wazuh-agent-4.14.0-1.msi /q WAZUH_MANAGER="172.25.99.253"
Once the agent is installed, we start the service.
Start-Service wazuhsvc
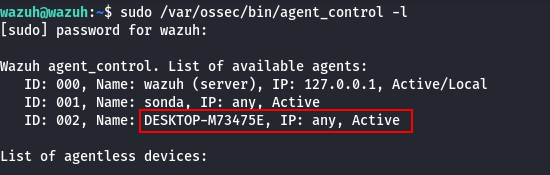
Finally, we verify that the Windows endpoint has been successfully integrated into the manager.
To install Grafana, we will use the following commands:
sudo apt-get install -y adduser libfontconfig1 musl

wget [https://dl.grafana.com/enterprise/release/grafana-enterprise_11.1.0_amd64.deb](https://dl.grafana.com/enterprise/release/grafana-enterprise_11.1.0_amd64.deb)

sudo dpkg -i grafana-enterprise_11.1.0_amd64.deb
We enable and start the service.
sudo systemctl enable grafana-server
sudo systemctl start grafana-server
And verify that everything is working properly.
All of these steps will be executed on the SONDA machine.
First, we install the service.
sudo apt update
sudo apt install suricata -y
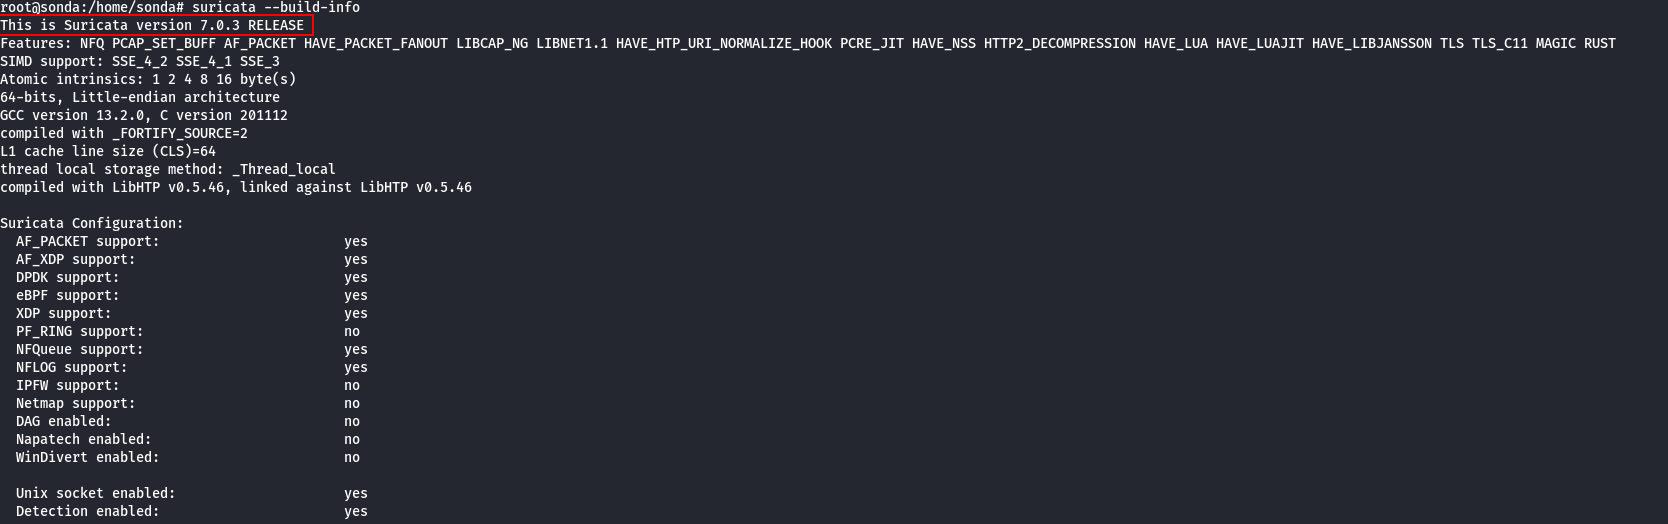
We verify that it is properly installed.
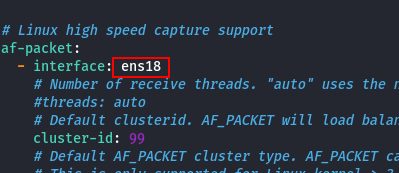
First, we need to configure the network interface.
sudo nano /etc/suricata/suricata.yaml
We must input our interface name, which can be checked using ip a.
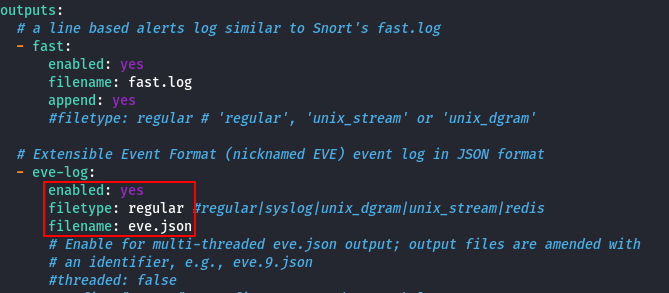
 Finally, inside
 suricata.yaml, we must ensure that the generated logs are compatible with Wazuh.
 Now we activate the service.
sudo systemctl enable suricata
sudo systemctl restart suricata
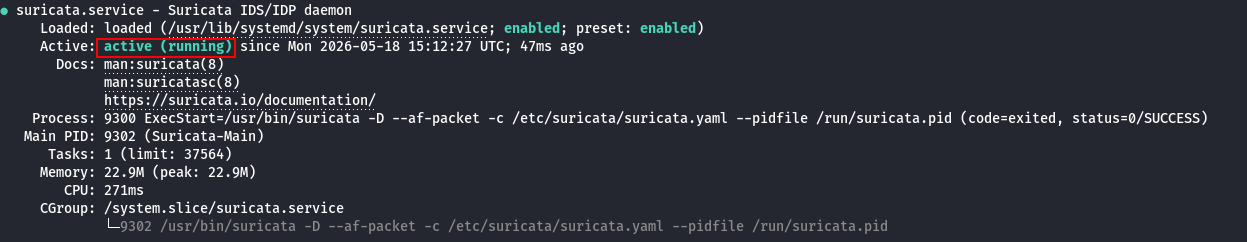
We verify that everything functions as expected.
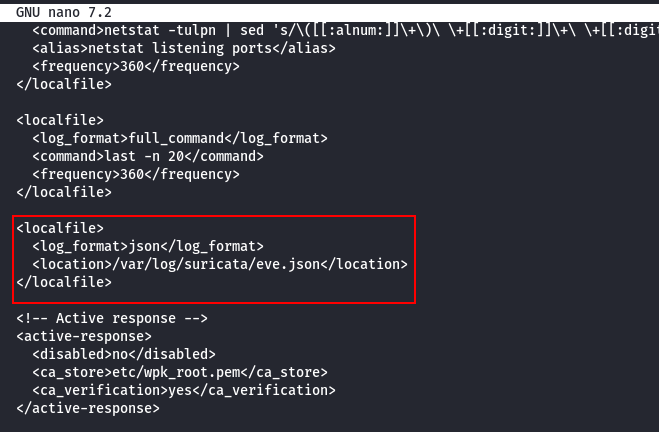
 Lastly, we must add the Suricata log source to the Wazuh agent. To do this, we edit
 /var/ossec/etc/ossec.conf.
We need to append the following block:
<localfile>
  <log_format>json</log_format>
  <location>/var/log/suricata/eve.json</location>
</localfile>
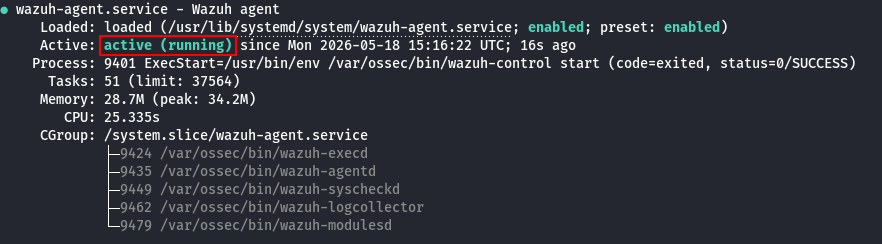
 And restart the agent.
sudo systemctl restart wazuh-agent
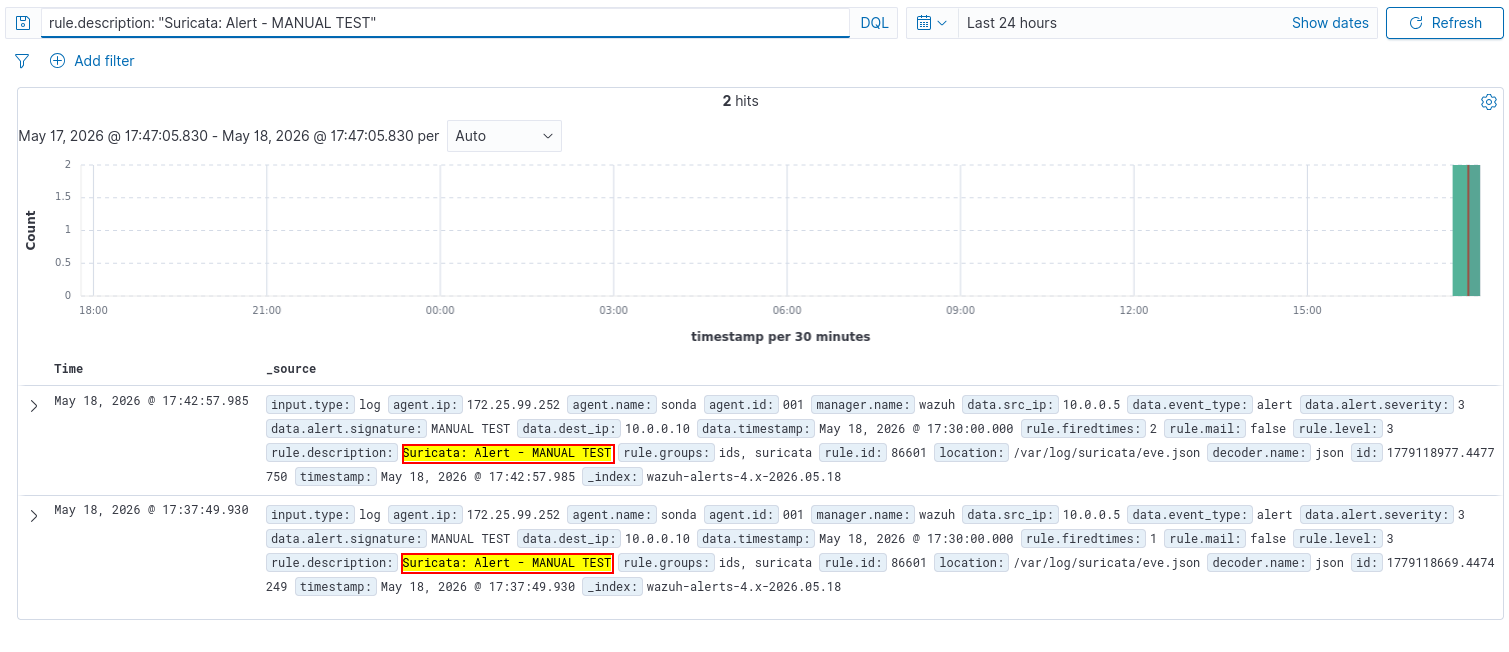
 We verify that Suricata is integrated by manually appending a test alert into the log file and checking if it populates in Wazuh.
echo '{"timestamp": "2026-05-18T15:30:00.000Z","event_type": "alert","src_ip": "10.0.0.5","dest_ip": "10.0.0.10","alert": {"signature": "TEST ALERT FROM SURICATA","severity": 3}}' | sudo tee -a /var/log/suricata/eve.json
We will use the Emergency Threats standard ruleset with Suricata. To do this, simply execute the following command:
sudo suricata-update
And restart Suricata.
sudo systemctl restart suricata
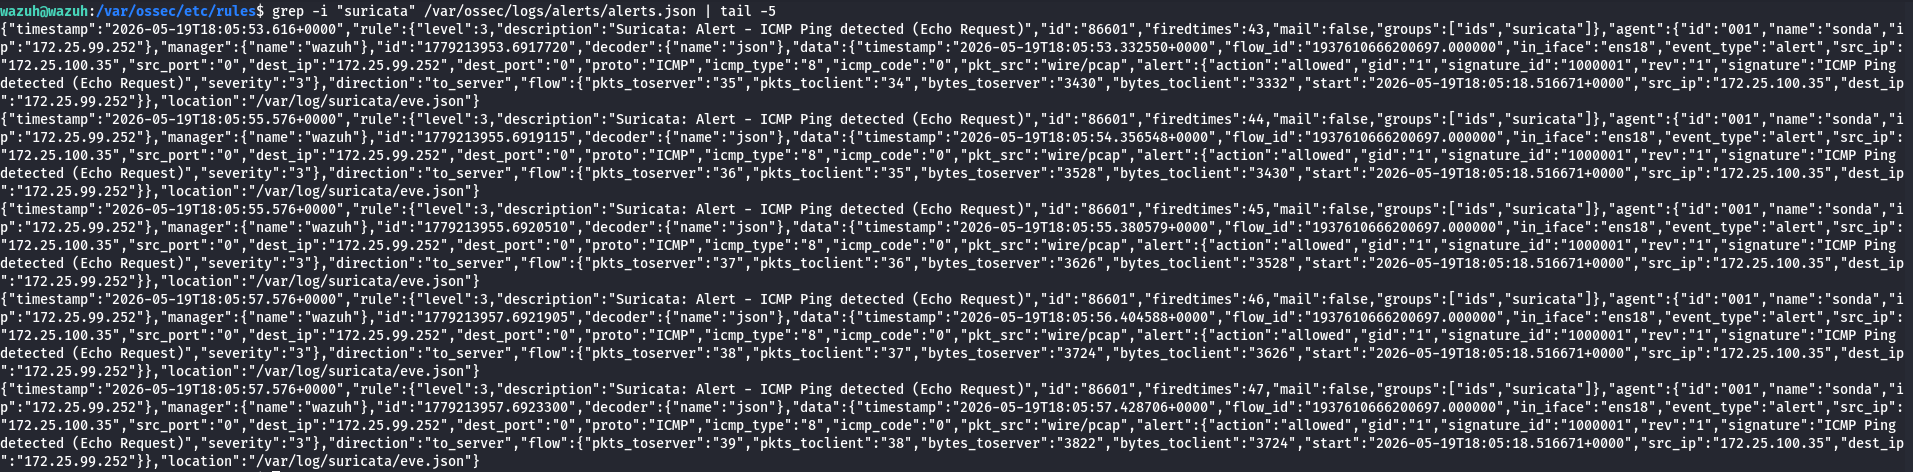
Once integrated, we double-check that they are actually operational and forwarding events successfully to Wazuh.
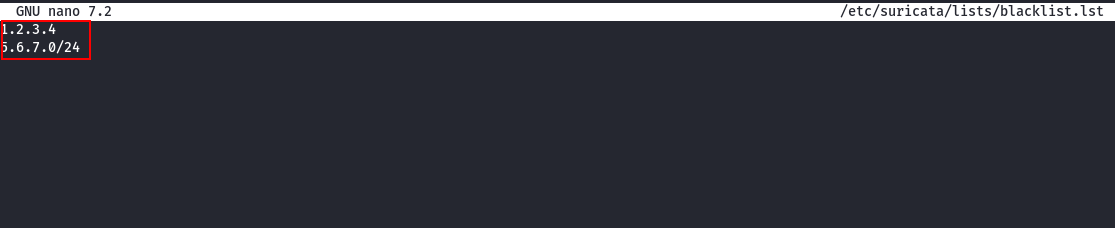
First, we must create a file where we will input the blacklisted IPs. In my case, this is /etc/suricata/lists/blacklist.lst.
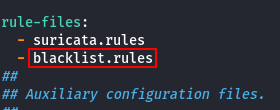
 Once this file is created, we need to set up a Suricata rule that blocks the IPs listed within it. To achieve this, we first create a new rules file, specifying its loading path inside
 suricata.yaml.
 Now we append the reputation files section into
 suricata.yaml:
reputation-categories-file: /etc/suricata/iprep/categories.txt
default-reputation-path: /etc/suricata/iprep
reputation-files:
  - blacklist-iprep.lst
And finally, we define the rule that will handle dropping/alerting inside /etc/suricata/rules/blacklist.rules.
alert ip any any -> any any (msg:"Blacklisted IP detected"; iprep:dst,Blacklist,>,50; sid:1000010; rev:1;)
Next, we generate the reputation data file where we will append the target IPs. In my setup, this is /etc/suricata/iprep/blacklist-iprep.lst.
72.25.100.35,1,100
1.1.1.1,1,100
We restart Suricata and test it.
If we want the rule to actively block packets, we must enable Suricata's IPS mode and introduce the following rules. In my implementation, taking advantage of the IP reputation weights, I will specify that IPs with a reputation value greater than 15 will be blocked, while those greater than 50 will only trigger alerts.
alert ip any any -> any any (msg:"Blacklisted IP detected"; iprep:dst,Blacklist,>,15; sid:1000010; rev:1;)
drop ip any any -> any any (msg:"Blacklisted IP blocked"; iprep:dst,Blacklist,>,50; sid:1000020; rev:1;)
Now we enable the IPS mode within the Suricata default configuration.
sudo sed -i 's/LISTENMODE=.*/LISTENMODE=nfqueue/' /etc/default/suricata
sudo sed -i 's/NFQUEUE=.*/NFQUEUE=0/' /etc/default/suricata

sudo iptables -I OUTPUT -j NFQUEUE --queue-num 0
sudo iptables -I INPUT -j NFQUEUE --queue-num 0
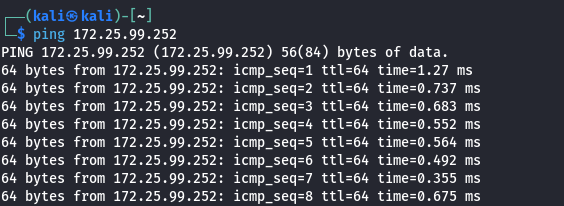
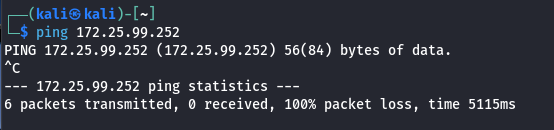
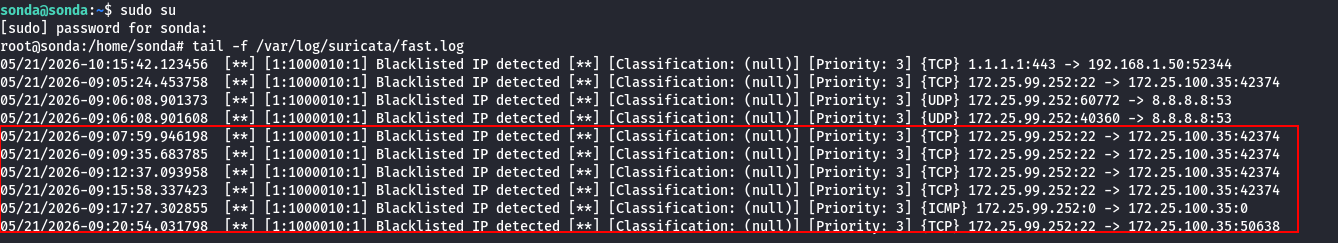
Now, the IP matching the rule threshold of 15 will be blocked.
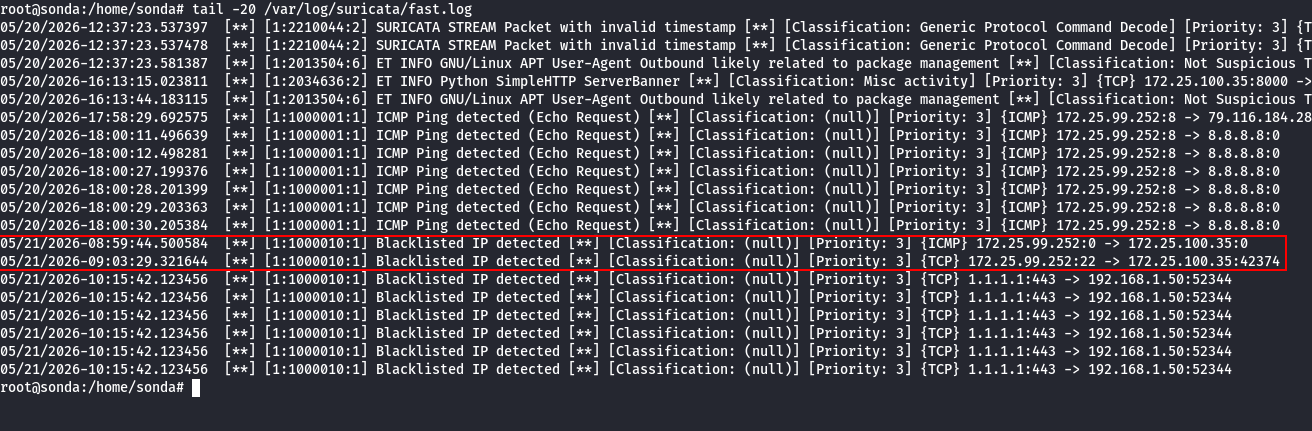
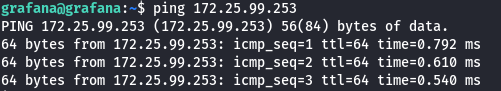
 And the IP threshold indicated as 50 will trigger an alert.
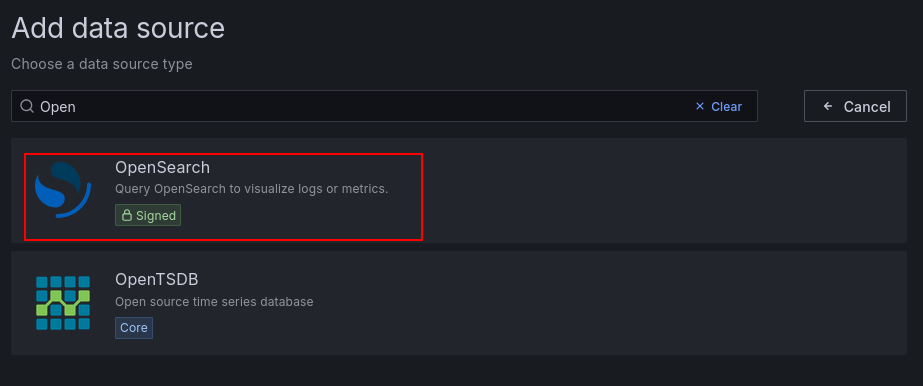
The first thing we must do is install the OpenSearch data source plugin for Grafana.
grafana-cli plugins install grafana-opensearch-datasource
sudo systemctl restart grafana-server
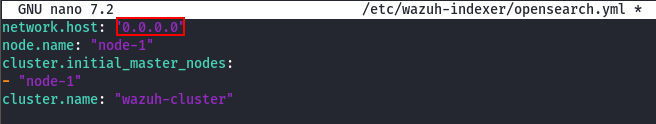
Now, inside the Wazuh Manager, we modify the network configuration so the Indexer can be reached from outside the local machine loopback interface.
/etc/wazuh-indexer/opensearch.yml
 And restart it.
sudo systemctl restart wazuh-indexer
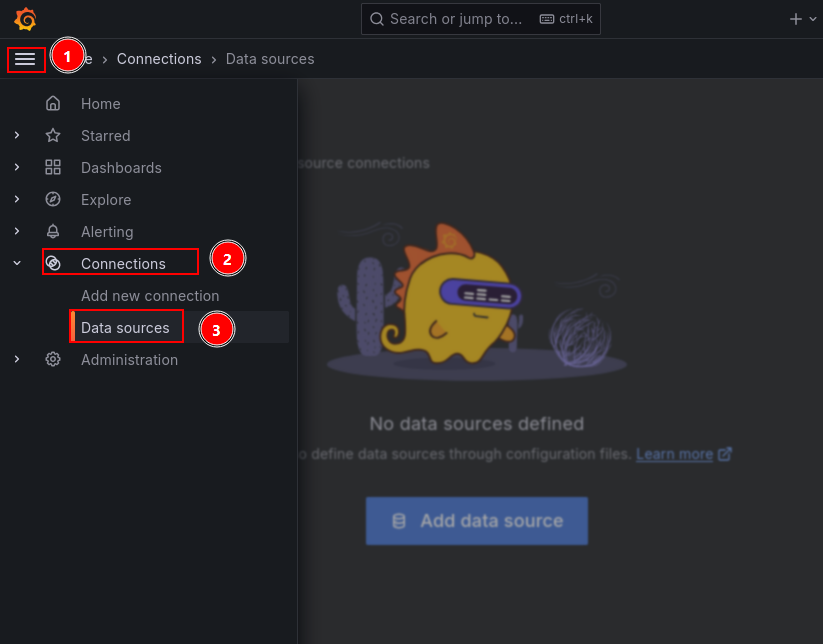
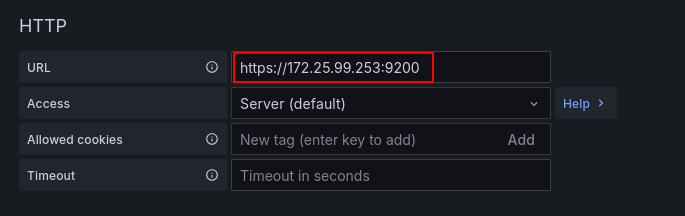
Now we create a Data Source in Grafana.
 We must configure the IP and port of our Wazuh Indexer.
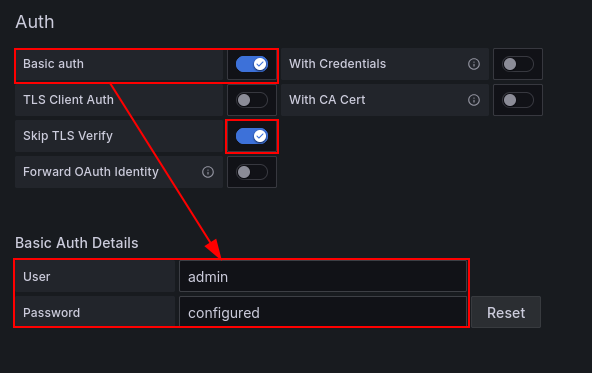
 We attach the authentication credentials using Basic Auth. As a side note, since I am utilizing self-signed certificates, we must disable TLS verification checking.
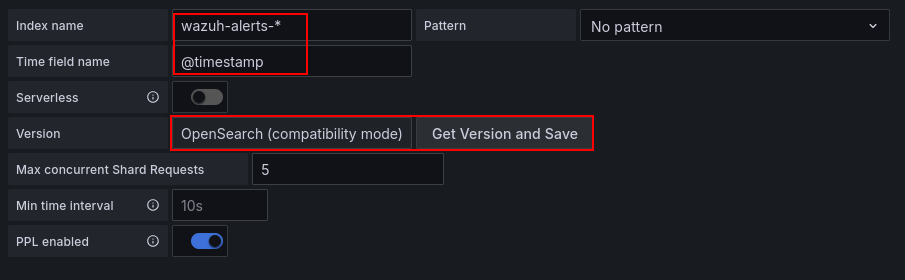
 Now, we have Grafana fetch the version of our
 wazuh-indexer and define the index matching patterns.
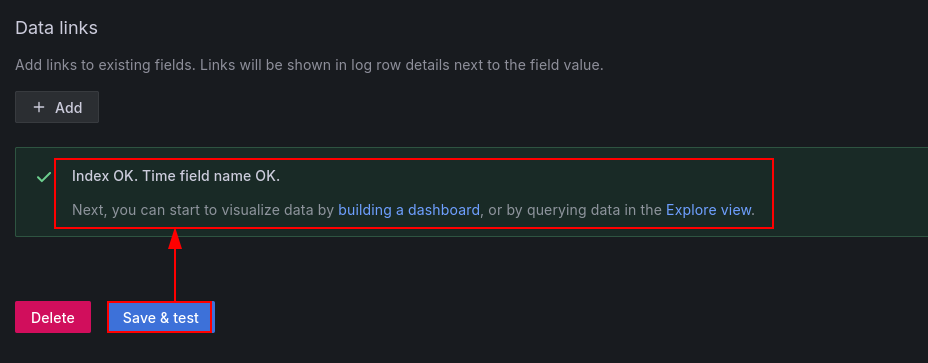
 And finally, save and test.
Once the data source is confirmed active, we will download and activate the dashboard panels. To do this, we first pull down the repository template.
git clone [https://github.com/TripleConsult/suricata_grafana_dashboard.git](https://github.com/TripleConsult/suricata_grafana_dashboard.git)
We need to specify our previously configured data source name within the .json configuration file we just pulled down.
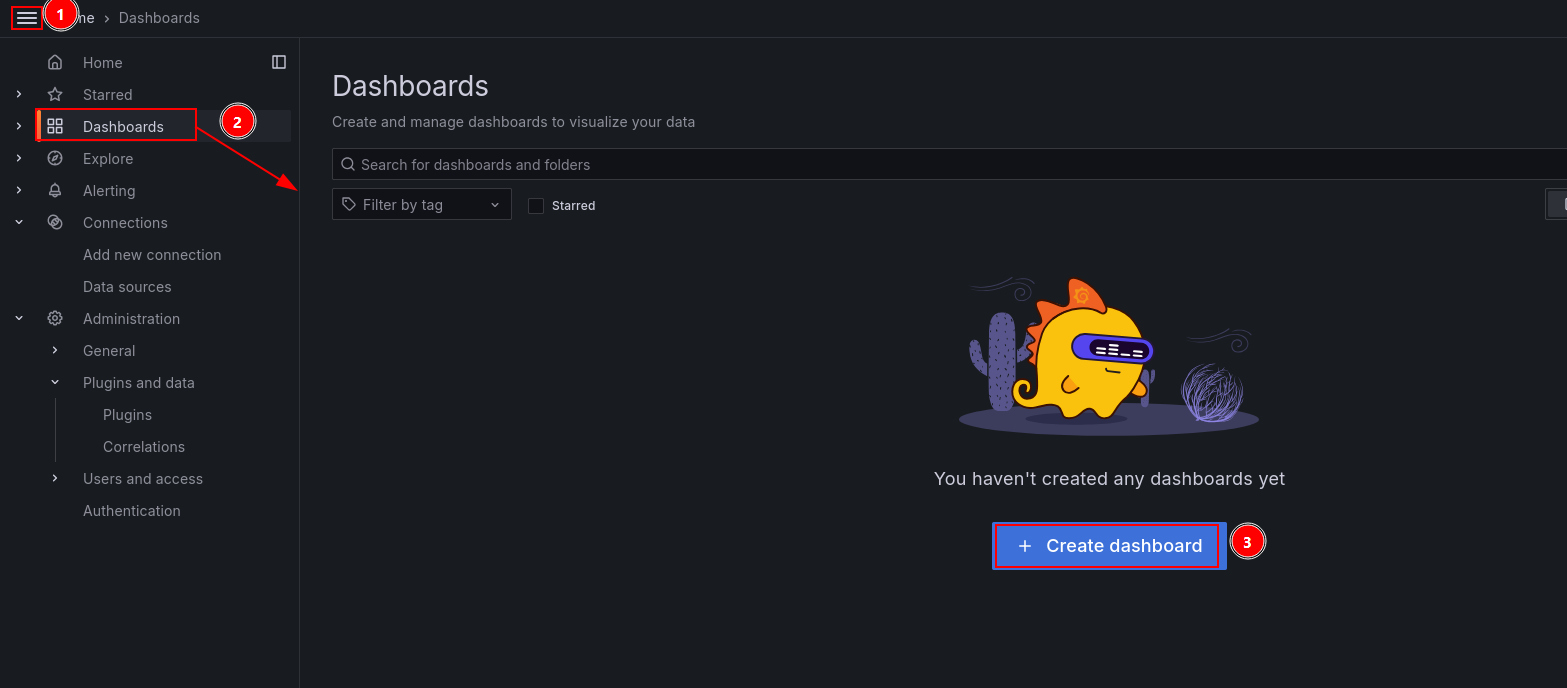
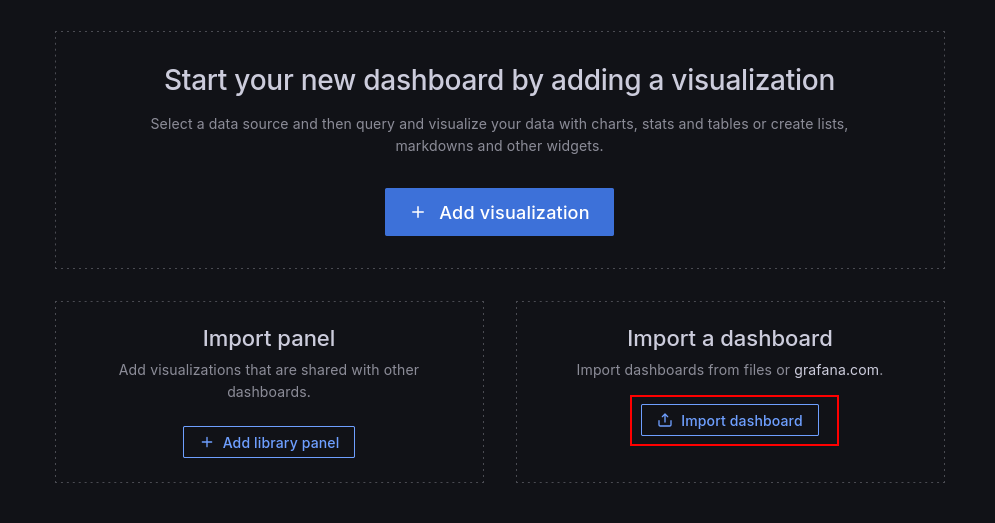
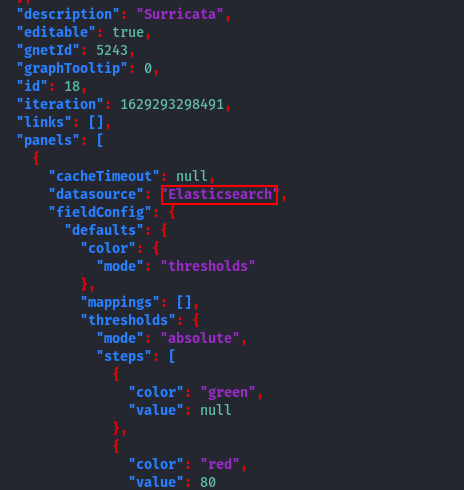 We create a new dashboard container.
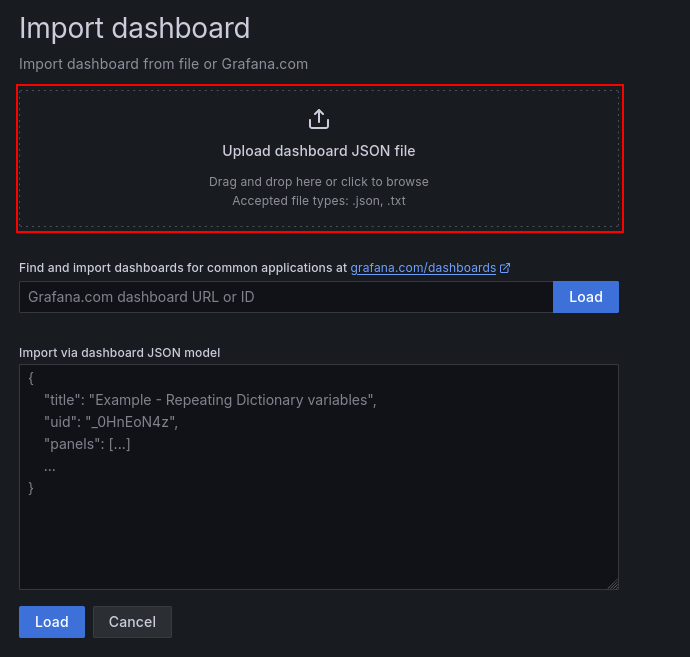
 And import the dashboard config file we modified.
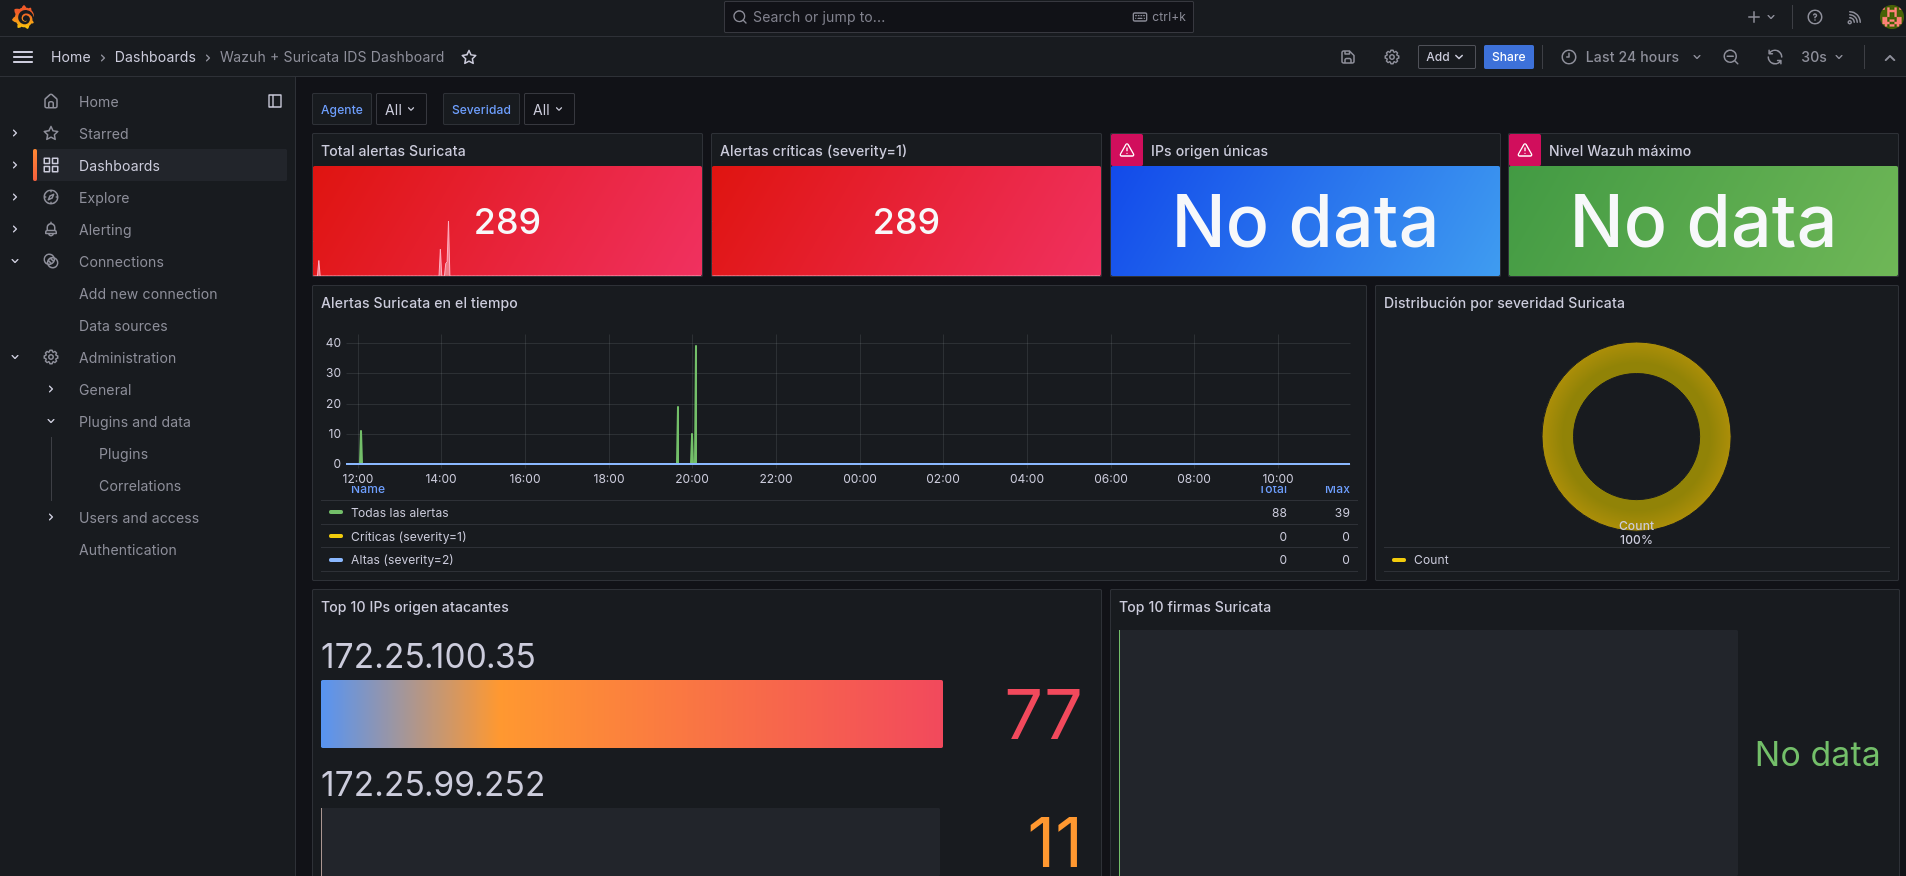
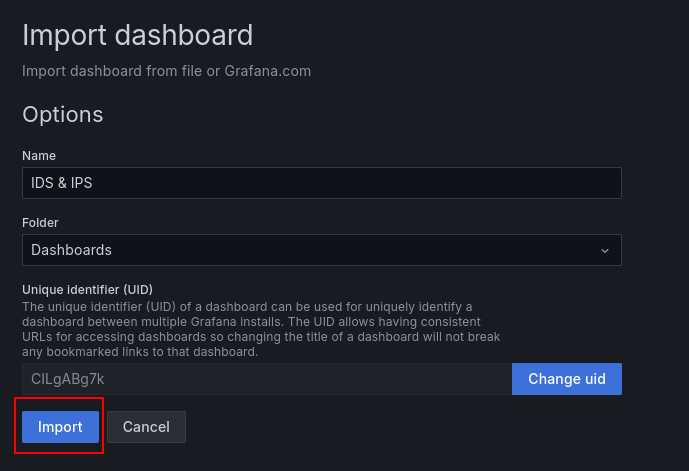 And now our custom dashboard panels are fully configured and ready to parse arriving data streams.
First, I created a custom decoder file under /var/ossec/etc/decoders/ejercicio2_decoder.xml with the following schema rules:
<decoder name="ejercicio2-csv">
  <prematch>chatgpt.com</prematch>
  <regex>([^ ]*) ([^ ]*) (.*)</regex>
  <order>timestamp,hostname,data</order>
</decoder>
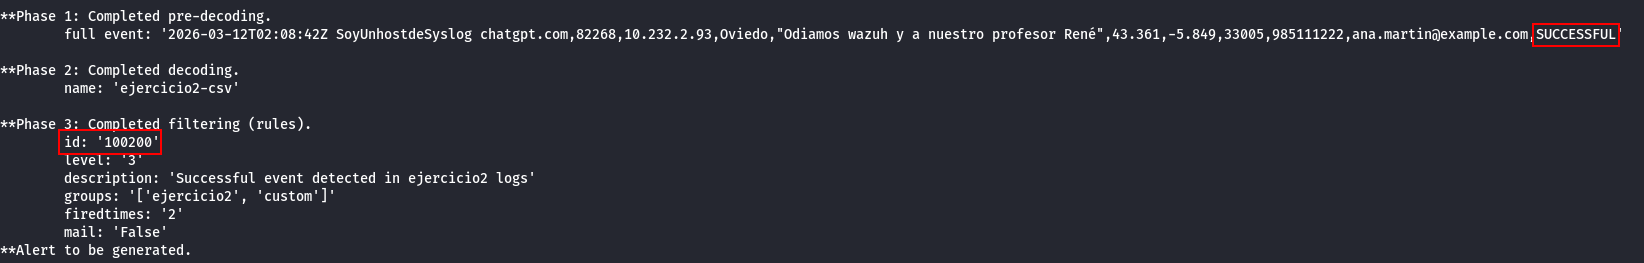
Next, I created the custom alerting logic template under /var/ossec/etc/rules/ejercicio2_rules.xml with the following configuration:
<group name="ejercicio2,custom">

  <rule id="100200" level="3">
    <decoded_as>ejercicio2-csv</decoded_as>
    <match>SUCCESSFUL</match>
    <description>Successful event detected in ejercicio2 logs</description>
  </rule>

</group>
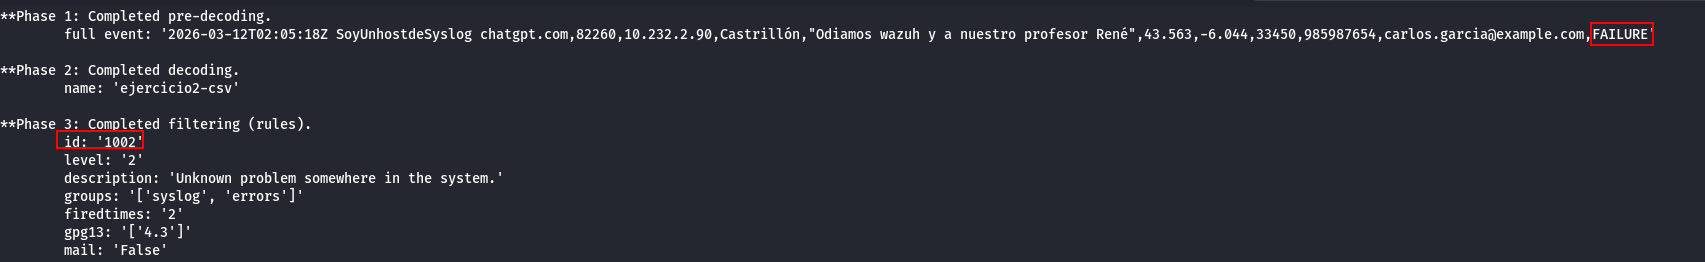
This rule parses and isolates the SUCCESSFUL status flag when receiving a matching incoming log stream to throw a targeted system alert, as verified by executing the wazuh-logtest utility tool.
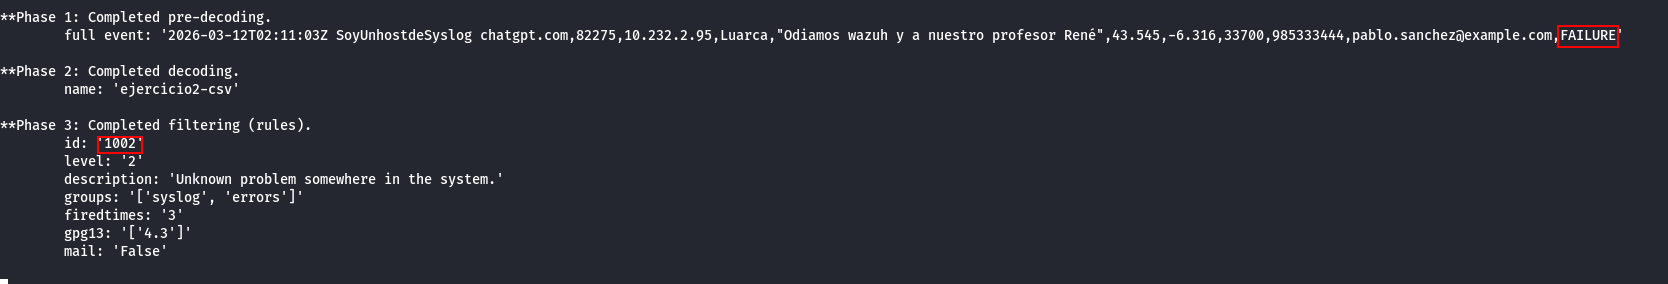
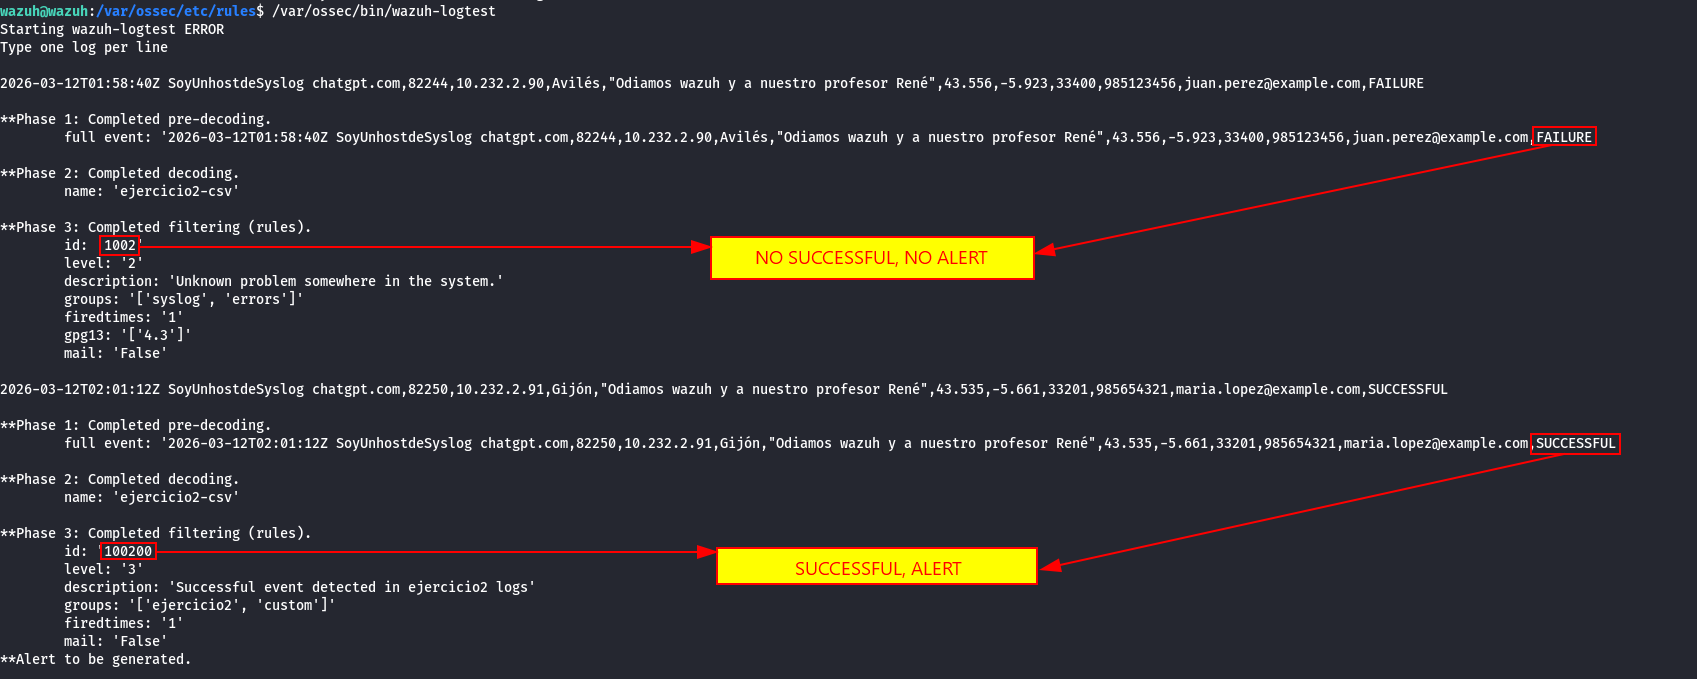 As demonstrated below, this architectural extraction pattern maps smoothly across the alternative testing event feeds provided by the instructor.
NOTE In an enterprise environment handling confidential infrastructure data and assets, care must be exercised to ensure that ONLY file hashes are forwarded to VirusTotal API nodes, rather than full documents.
First, we register a personal account profile with virustotal to request access to a functional public API interaction key.
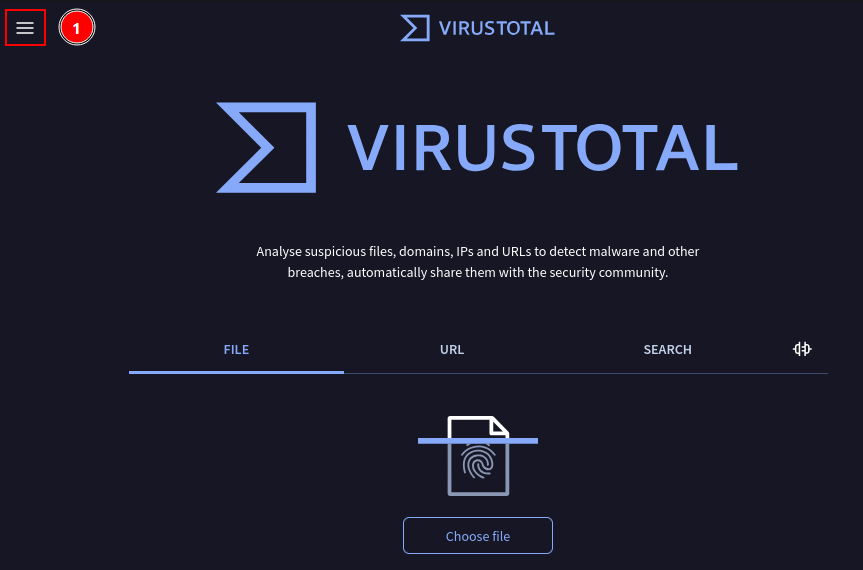
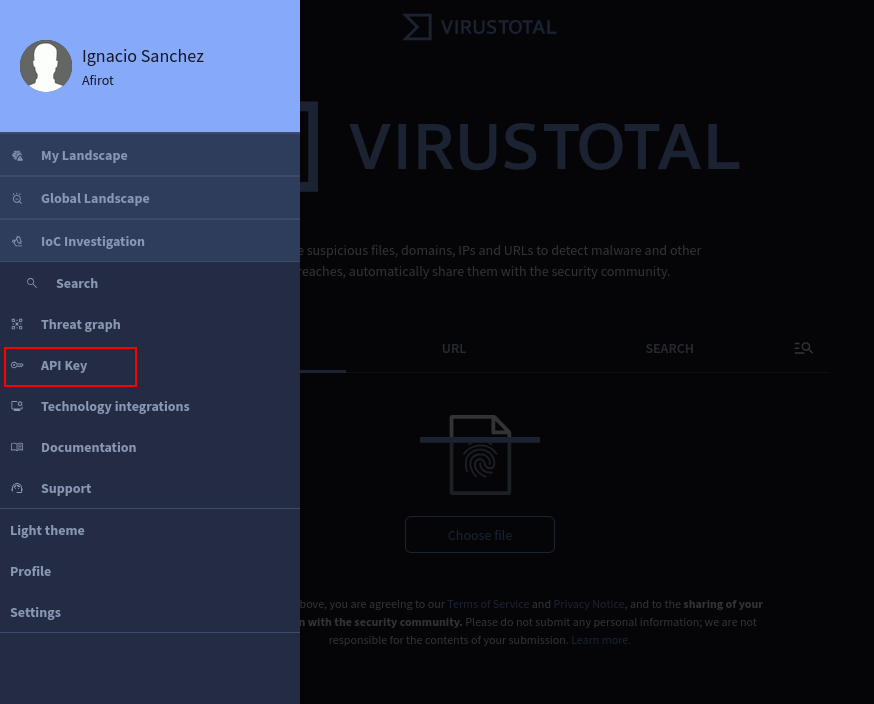
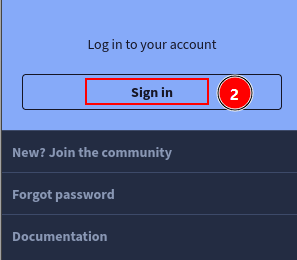 Once logged into the profile portal, navigate to the API access page.
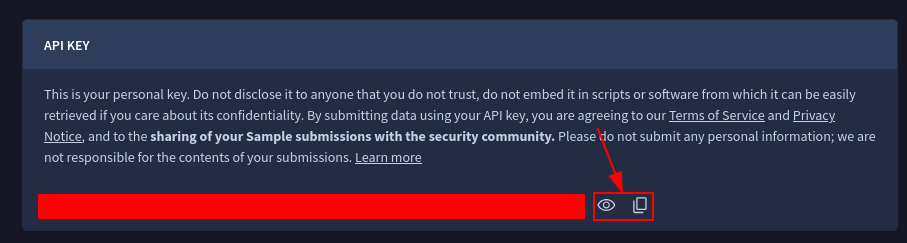
 Now we copy our generated personal API string key.
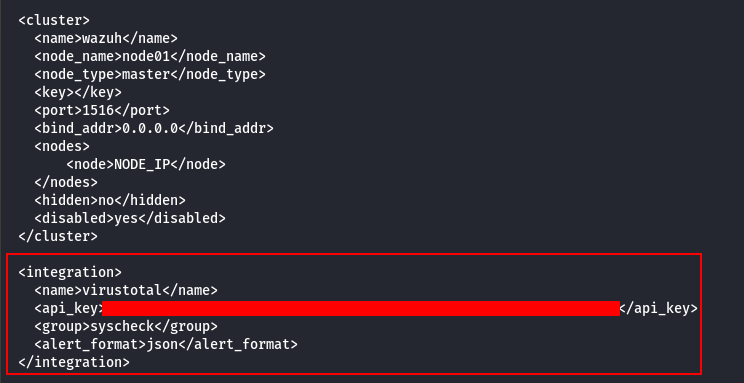
 With our API parameter secured, we configure the backend module components inside the Wazuh Manager profile.
/var/ossec/etc/ossec.conf
<integration>
  <name>virustotal</name>
  <api_key>API_KEY</api_key>
  <group>syscheck</group>
  <alert_format>json</alert_format>
</integration>
 Now, restart the
 wazuh-manager service to apply our configuration tracking changes.
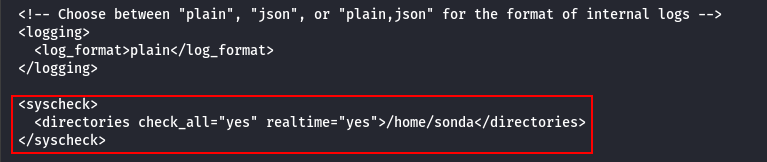
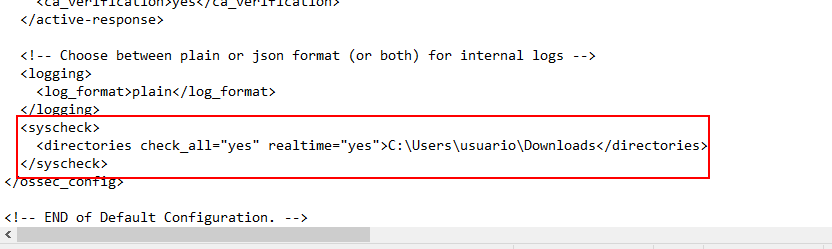
Inside the file /var/ossec/etc/ossec.conf located on our sonda monitored node, we append the real-time monitoring criteria rule block below:
<syscheck>
  <directories check_all="yes" realtime="yes">/home/sonda</directories>
</syscheck>
 Restart the localized
 wazuh-agent daemon to register the dynamic file integrity parameters.
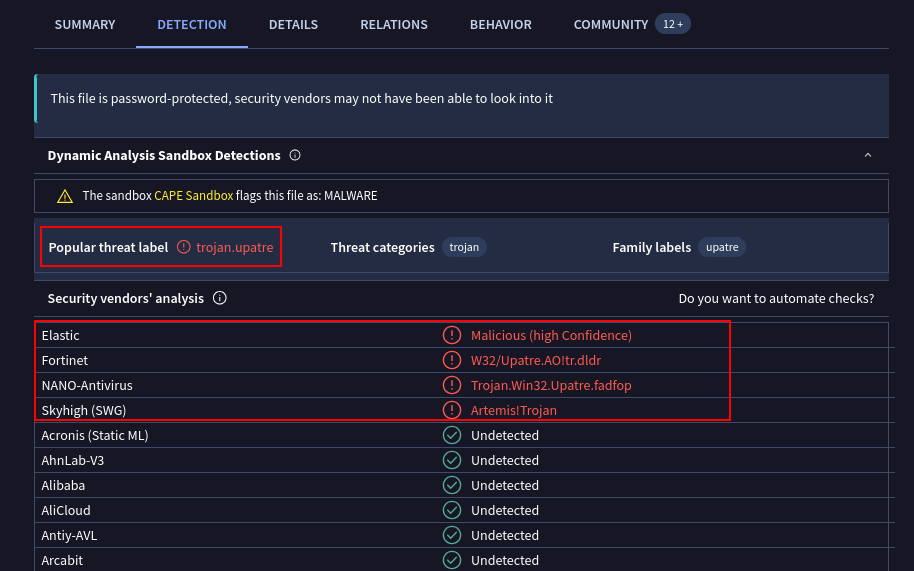
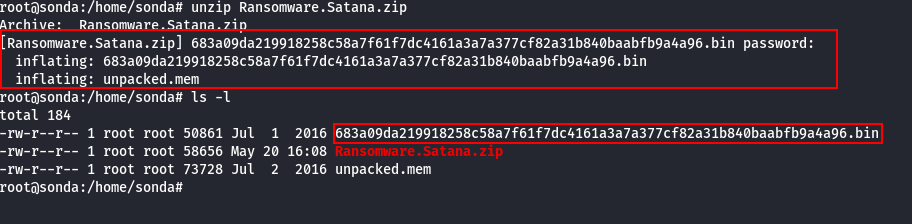
For testing validation, I fetched a sample ransomware binary package which I have confirmed is recognized under VirusTotal signature datasets.
 I drop and extract the binary payload within our target tracked directory space.
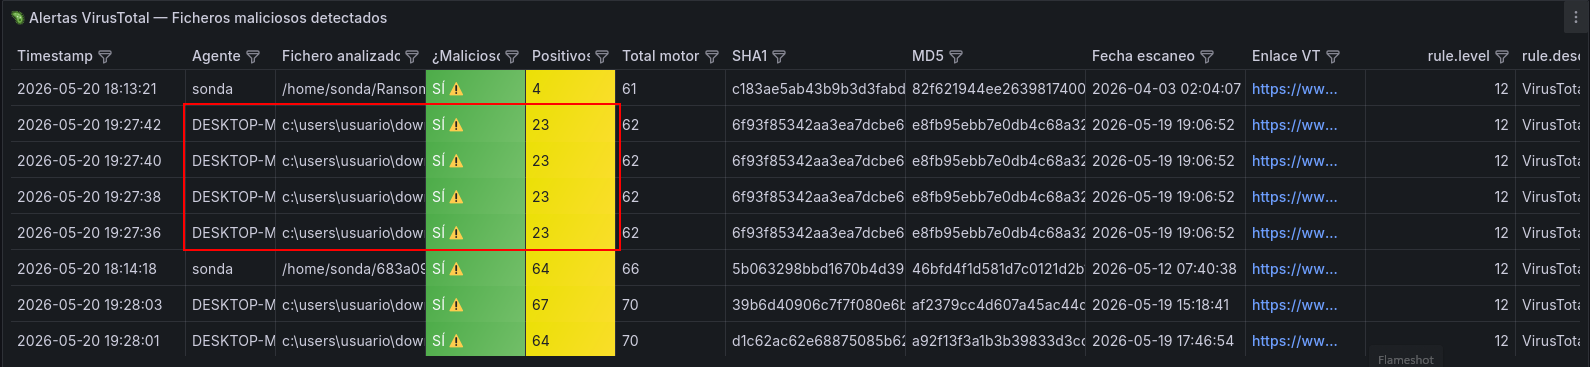
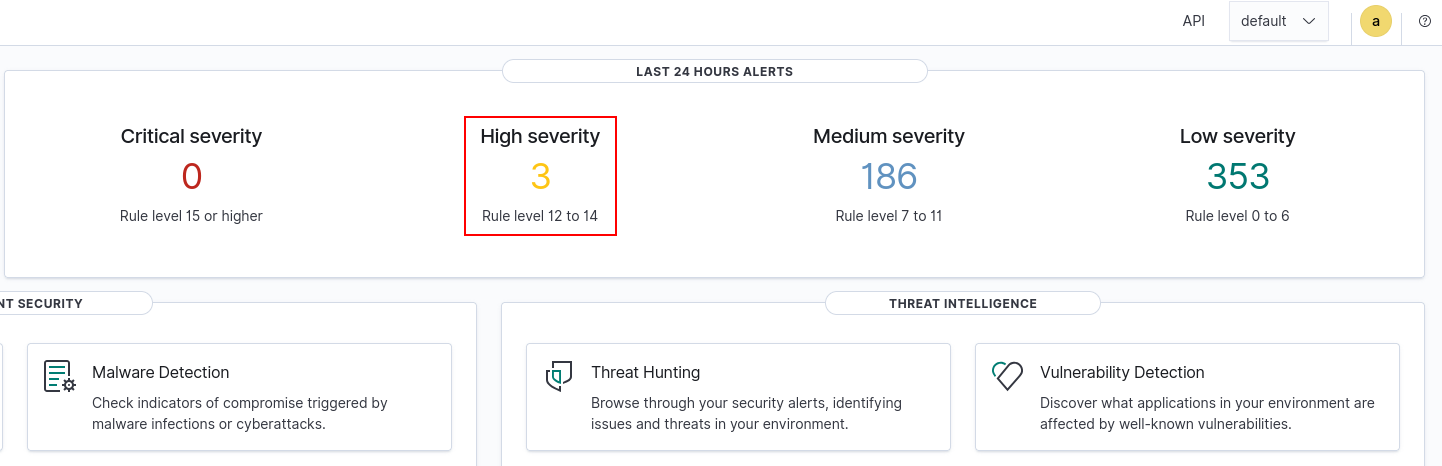
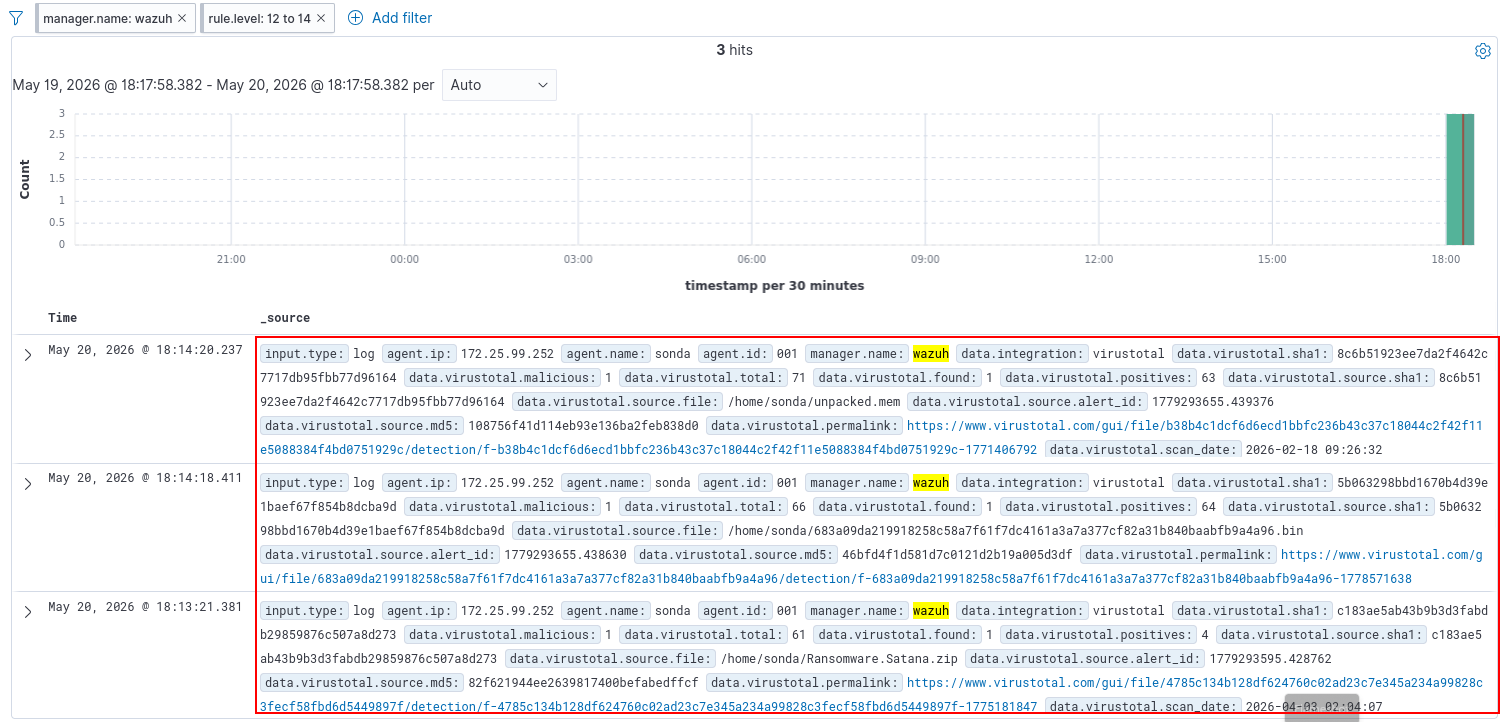
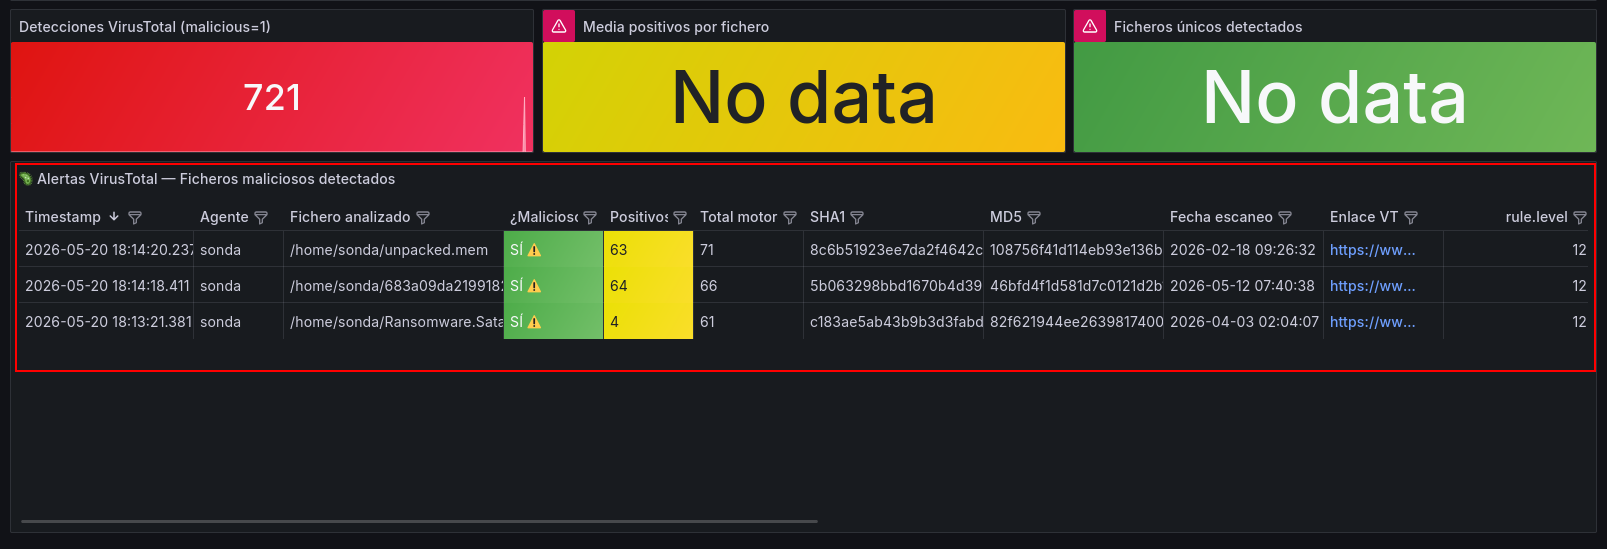
 Checking our security dashboard feed inside Wazuh shows three new active alert matches populated into the stream.
 These events match our expected intelligence analysis reports delivered back by the VirusTotal lookup integration hook.
 The resulting parsed telemetry feeds populate our centralized metrics viewing canvas inside Grafana as well.
We must perform an identical rule file mapping edit, though on this endpoint architecture, the baseline monitoring options file is located under C:\Program Files (x86)\ossec-agent\ossec.conf.
 And restart the client system service.
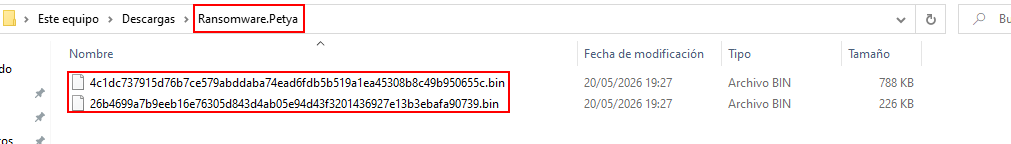
Now we replicate the functional validation workflow executed above. From the public malwareZoo data hub, I pull a known threat actor payload signature indexed within the active threat catalogs. I download it onto the local disk space and expand it without ever launching the file.
Note that for this validation round, I had to completely deactivate standard Windows Defender protection layers, as it would otherwise automatically isolate the Petya malware sample before our agent tracking hooks could monitor its disk placement.
 As verified across our active Grafana metrics boards, the integration module systematically picked up the footprint, Wazuh safely categorized the log ingest stream, and Grafana updated the telemetry visualization layer instantly.